Hydrogen Improves Glycemic Control in Type1 Diabetic Animal Model by Promoting Glucose Uptake into Skeletal Muscle

Research article: Hydrogen Improves Glycemic Control in Type1 Diabetic Animal Model by Promoting Glucose Uptake into Skeletal Muscle

Author: Haruka Amitani,Akihiro Asakawa ,Kaichun Cheng,Marie Amitani,Kaori Kaimoto,Masako Nakano,Miharu Ushikai,Yingxiao Li,Minglun Tsai,Jiang-Bo Li,Mutsumi Terashi,Huhe Chaolu,Ryozo Kamimura,Akio Inui
 2013 Jan 10;8(1):e53913. doi: 10.1371/journal.pone.0053913

Abstract

Hydrogen (H2) acts as a therapeutic antioxidant. However, there are few reports on H2 function in other capacities in diabetes mellitus (DM). Therefore, in this study, we investigated the role of H2 in glucose transport by studying cultured mouse C2C12 cells and human hepatoma Hep-G2 cells in vitro, in addition to three types of diabetic mice [Streptozotocin (STZ)-induced type 1 diabetic mice, high-fat diet-induced type 2 diabetic mice, and genetically diabetic db/db mice] in vivo. The results show that H2 promoted 2-[14C]-deoxy-d-glucose (2-DG) uptake into C2C12 cells via the translocation of glucose transporter Glut4 through activation of phosphatidylinositol-3-OH kinase (PI3K), protein kinase C (PKC), and AMP-activated protein kinase (AMPK), although it did not stimulate the translocation of Glut2 in Hep G2 cells. H2 significantly increased skeletal muscle membrane Glut4 expression and markedly improved glycemic control in STZ-induced type 1 diabetic mice after chronic intraperitoneal (i.p.) and oral (p.o.) administration. However, long-term p.o. administration of H2 had least effect on the obese and non-insulin-dependent type 2 diabetes mouse models. Our study demonstrates that H2 exerts metabolic effects similar to those of insulin and may be a novel therapeutic alternative to insulin in type 1 diabetes mellitus that can be administered orally.

Introduction

Diabetes mellitus (DM) is characterized by abnormal insulin secretion, derangements in carbohydrate-lipid metabolism, and chronic hyperglycemia. The total number of people with DM is predicted to rise from 171 million in 2000 to 366 million in 2030 . Therefore, various therapies, including alternative medicine, are being developed for DM. Insulin-like growth factor 1 (IGF-1) exerts metabolic effects similar to those of insulin , . Although IGF-1 was once thought to have the same effect as insulin, recently a relationship between IGF-1 and diabetic retinopathy has been suggested . Indeed, the only treatment for progressed DM is insulin therapy.Insulin initiates its action by binding its specific cell-surface receptor, insulin receptor (IR), in the peripheral tissues such as skeletal muscle and liver under normal conditions. IR is a heterotetrameric protein that consists of two extracellular α-subunits and two transmembrane ÎČ-subunits connected by disulfide bridges. Insulin signaling is initiated following binding of insulin to the extracellular α-subunits. This results in autophosphorylation of the ÎČ-subunits and activation of the tyrosine kinase domain of the intracellular part of the ÎČ subunits . The active tyrosine kinase of IR phosphorylates IR substrate (IRS) proteins. Then, the phosphorylated IRS proteins recruit and activate phosphatidylinosisitol 3-kinase (PI3K). IR, IRS, and PI3K are considered critical nodes in insulin signaling . The activated PI3K activates its downstream effectors, such as Akt and protein kinase C (PKC), by increasing the production of its lipid product, phosphatidylinositol-3,4,5-(PO4)3, which leads to glucose uptake.Hydrogen (H2) is the lightest gas molecule. The numerous strains of intestinal bacteria, primarily in the large intestine, produce H2, and approximately 14% of H2 is absorbed in the colon and released from the lungs . The hydrogen breath test has become popular in clinical practice because it is useful to assess abnormal pathophysiology, such as bacterial overgrowth in the small intestine, and to diagnose lactose or fructose malabsorption . Gharib et al reported the antioxidant effect of H2 using mice with parasite-induced liver inflammation . Ohsawa et al recently reported that hydrogen acts as a therapeutic anti-oxidant by selectively reducing hydroxyl radicals (·OH) . H2 affects ischemia-reperfusion injury , , atherosclerosis , Parkinson’s disease , acute pancreatitis , and type 1 allergic reaction . Currently, there are more than 100 reports related to antioxidant effects of H2.Although several studies have described the antioxidant effect of H2 on DM , , few studies have reported on other functions of H2 in DM. Therefore, in this study, we investigated the role of H2 in glucose homeostasis by studying cultured mouse C2C12 cells and human hepatoma Hep G2 cells in vitro, as well as three types of diabetic mice (STZ-induced diabetic mice, high-fat diet induced diabetic mice, and genetically diabetic db/db mice) in vivo.

Results

H2 Promotes 2-DG Uptake into C2C12 Cells

Figure 1A shows the effect of hydrogen on 2-DG uptake into C2C12 cells. Stimulation of 2-DG uptake into C2C12 cells after 30 and 60 min exposure to HHW was significantly increased over control. NHW also significantly increased the 2-DG uptake into C2C12 cells compared to the control, but degassed NHW did not increase 2-DG uptake (Fig. 1B). The addition of LY-2940002 at 1.0 × 10⁻⁶ M significantly decreased the 2-DG uptake into C2C12 cells compared with HHW alone (Fig. 1C). The addition of chelerythrine at 1.0 × 10⁻⁶ M (Fig. 1D) and the addition of Compound C at 1.0 × 10⁻⁶ M (Fig. 1E) significantly decreased the 2-DG uptake into C2C12 cells compared with HHW.

Figure 1. The effect of H2 on glucose uptake into C2C12 cells.

Figure 1

(A) 2-DG uptake into C2C12 cells after 30 or 60 min exposure to high content hydrogen water (HHW) was significantly increased over control (n = 6 for each group). (B) Natural hydrogen water (NHW) significantly increased 2-DG uptake into C2C12 cells over control, while degassed NHW did not increase 2-DG uptake (n = 7 for each group). (C, D, E) After incubation with or without each pharmacological inhibitor for 30 min, the cells were exposed to pure water or SHW for another 30 min. The addition of LY-2940002, a phosphatidylinositol-3-OH kinase (PI3K) inhibitor, at 1.0 × 10⁻⁶ M significantly decreased the 2-DG uptake into C2C12 cells compared with HHW alone (n = 6 for each group). The addition of chelerythrine, a protein kinase C (PKC) inhibitor, at 1.0 × 10⁻⁶ M significantly decreased the 2-DG uptake into C2C12 cells compared with HHW alone (n = 6 for each group). The addition of Compound C (6-[4-(2-piperidin-1-ylethoxy)-phenyl]-3-pyridin-4-ylpyrazolo[1,5-a] pyrimidine), an AMP-activated protein kinase (AMPK) inhibitor, at 1.0 × 10⁻⁶ M significantly decreased the 2-DG uptake into C2C12 cells compared with HHW alone (n = 10 for each group). (F, G) Western blot analysis was performed as described in the Materials and Methods. HHW increased membrane Glut4 (n = 6 for each group) and phosphorylated AMPK (p-AMPK) (n = 13 for each group) in C2C12 cells. (H, I) There was no significant difference in total AMPK in C2C12 cells (n = 8 for each group) or membrane Glut2 in Hep-G2 cells between groups (n = 6 for each group). Comparisons with controls were performed by unpaired Student’s t test between two groups and Dunnett’s multipule comparison test among more than two groups. *P<0.05, **P<0.01, ***P<0.001.

Western blot analysis showed that HHW significantly increased membrane Glut4 and phosphorylated AMPK (p-AMPK) in C2C12 cells (Fig. 1F, 1G). The bar graph represents the ratio of the each protein to actin protein bands quantified by densitometric analysis. There was no significant difference in total AMPK in C2C12 cells or membrane Glut2 in Hep G2 cells between treatments (Fig. 1H, 1I). These data indicate that the effect of H2 is in the muscle rather than in the liver.

H2 Remains Higher in NHW and Saline Water than Pure Water

Figure 2 shows the H2 attenuation rate in LHW, HHW, NHW, and 0.17 mM (0.001%) and 0.34 mM (0.002%) saline water with 0.8 mM H2 for 24 hours. NHW, 0.17 mM saline water and 0.34 mM saline water had significantly higher H2 concentrations than LHW and HHW at 12 and 24 hours.

Figure 2. The H2 attenuation rate in pure water and several solutions.

Figure 2

Natural hydrogen water (NHW) and 0.17 mM (0.001%) and 0.34 mM (0.002%) saline water with 0.8 mM H2 retained a higher hydrogen concentration than low-content (LHW) and high-content hydrogen water (HHW) at 12 and 24 hours (n = 7 for each group). Multiple comparisons were performed by Dunnett’s multipule comparison test. **P<0.01 vs LHW, ## P<0.01 vs HHW.

The Antioxidant Effect of H2 is Weaker than N-acetyl-cysteine (NAC) and Vitamin C

The % antioxidant activity of H2 was significantly lower than NAC and vitamin C [H2 (n = 6), 47.22% ±5.60; NAC (n = 6), 80.25±2.62; vitamin C (n = 6), 91.62±1.42, respectively; P<0.01].

Chronic i.p. Administration of H2 Improves Hyperglycemia in STZ-induced Diabetic Mice

Blood glucose in the group injected with HHS after STZ administration was significantly lower than in the control (saline) group at every 7-day interval measurement (Fig. 3A). Body weights and food intake were monitored throughout the experimental period. There was no significant difference in body weight or food intake between the HHS and control groups (Fig. 3B, 3C). Blood glucose in the day-30 IPGTT was significantly lower in the HHS group than the control group at 5, 30, 60 and 120 min (Fig. 3D). In addition, the area under the curve (AUC) of the HHS group was significantly lower than the control group (Fig. 3E). In the western blot analysis of soleus muscle, membrane Glut4 was significantly upregulated in the HHS group compared to the control group (Fig. 3F), whereas cytosolic Glut4 showed a tendency to decrease in the HHS group, although this difference was not significant (Fig. 3G). Fasting plasma glucose, glycated albumin and triglyceride obtained on day 32 were significantly lower than the control group (Table 1). There was no significant difference in other parameters, including insulin and liver and kidney function tests.

Figure 3. The effect of i.p. administration of H2 on hyperglycemia in STZ-treated mice.

Figure 3

(A) Blood glucose in the group injected with high-content hydrogen saline (HHS) after STZ administration was significantly lower than the control group at every 7-days-interval measurement (n = 16 for each group). (B, C) Body weight and food intake every 7 day are shown. Although there was no significant difference in body weights or food intake between the control and HHS groups (n = 16 for each group), the food intake in the HHS group showed a tendency to decrease. (D, E) Blood glucose in the HHS group in the day-30 IPGTT was significantly lower than the control group at 5, 30, 60 and 120 min, and the area under the curve (AUC) of the HHS group was significantly lower than control (n = 16 for each group). (F) Membrane Glut4 in the HHS group was significantly increased compared to the control group, as determined by western blot analysis (n = 6 for each group). (G) Although there was no significant difference in cytosolic Glut4 between groups, the cytosolic Glut4 in the HHS group showed a tendency to decrease (n = 4 for each group). The bar graph shows the ratio of each protein to actin protein bands quantified by densitometric analysis. Comparisons with controls were performed by unpaired Student’s t test between two groups. *P<0.05, **P<0.01, ***P<0.001.

Chronic p.o. Administration of H2 Improves Diabetes in STZ-induced T1DM Mice

Blood glucose in the HHW and NHW groups showed a tendency to decrease, but these decreases were not statistically significant (Fig. 4A). The AUC values of the NHW group in the day-90 and day-120 IPGTTs were significantly decreased, although the decrease in the AUC values of the LHW and HHW groups did not reach statistical significance (Fig. 4B, C). On day 121, some mice in another animal room of our laboratory were found to be infected with mouse hepatitis virus (MHV). Although no mouse was infected with MHV in our animal room, we were unfortunately forbidden to change rooms and could not supply our mice with hydrogen water. Several mice were lost due to dehydration, and we therefore sacrificed all of the mice in this experiment at that time. We combined the data of two groups [LHW (n = 2) and HHW (n = 2)] together. The combined LHW and HHW group, as well as NHW group (n = 6), demonstrated markedly lowered glycated albumin levels compared with the control group (Fig. 4D). The triglyceride level in the combined LHW and HHW group and NHW group, as well as the non-esterified free fatty acid (NEFA) level in the NHW group significantly decreased compared with the control group (Table 2). There was no significant difference in any other parameter, such as insulin and liver and kidney function tests.

Figure 4. The effect of p.o. administration of H2 on diabetes in STZ-induced type 1 diabetic mice.

Figure 4

(A) Blood glucose in the high content hydrogen water (HHW) and natural hydrogen water (NHW) groups at every weekly measurement showed a tendency to decrease compared to control, but, these decreases were not statistically significant (n = 6 for each group). (B, C) The AUC values of NHW group in the day-90 and day-120 IPGTTs were significantly decreased. Although the AUC values of the LHW, HHW groups in the day-90 and day-120 IPGTTs showed a tendency to decrease, these decrease were not statistically significant (n = 6 for each group). (D) As described in the Results, several mice were lost due to dehydration, so we combined the data of two groups [HHW (n = 2) and LHW (n = 2)] together. Glycated albumin in the combined LHW and HHW group (n = 4) and NHW group (n = 6) was significantly lower than the control group (n = 6). Comparisons with controls were performed by Dunnett’s multipule comparison test. *P<0.05, **P<0.01.
The food intake and body weight in the LHW, HHW and NHW groups showed a tendency to decrease in the course of the experiment (Fig. 5A, 5B). HHW and NHW significantly decreased body weight gain at 25, 26, 27, and 28 weeks of age (Fig. 5C). HHW significantly decreased food intake gain at 27 weeks of age and NHW significantly decreased food intake gain at 26, 27, and 28 weeks of age (Fig. 5D). Therefore, we examined the potential changes of the expression of the hypothalamic feeding-regulatory peptides. Orexigenic MCH and orexin mRNA and anorexigenic POMC mRNA expressions in the hypothalamus during fasting were significantly increased in the combined LHW, HHW, and NHW group compared with the control group. (Fig. 5E). There was no significant difference in other hypothalamic peptide as well as gastric ghrelin mRNA expression (Fig. 5F).

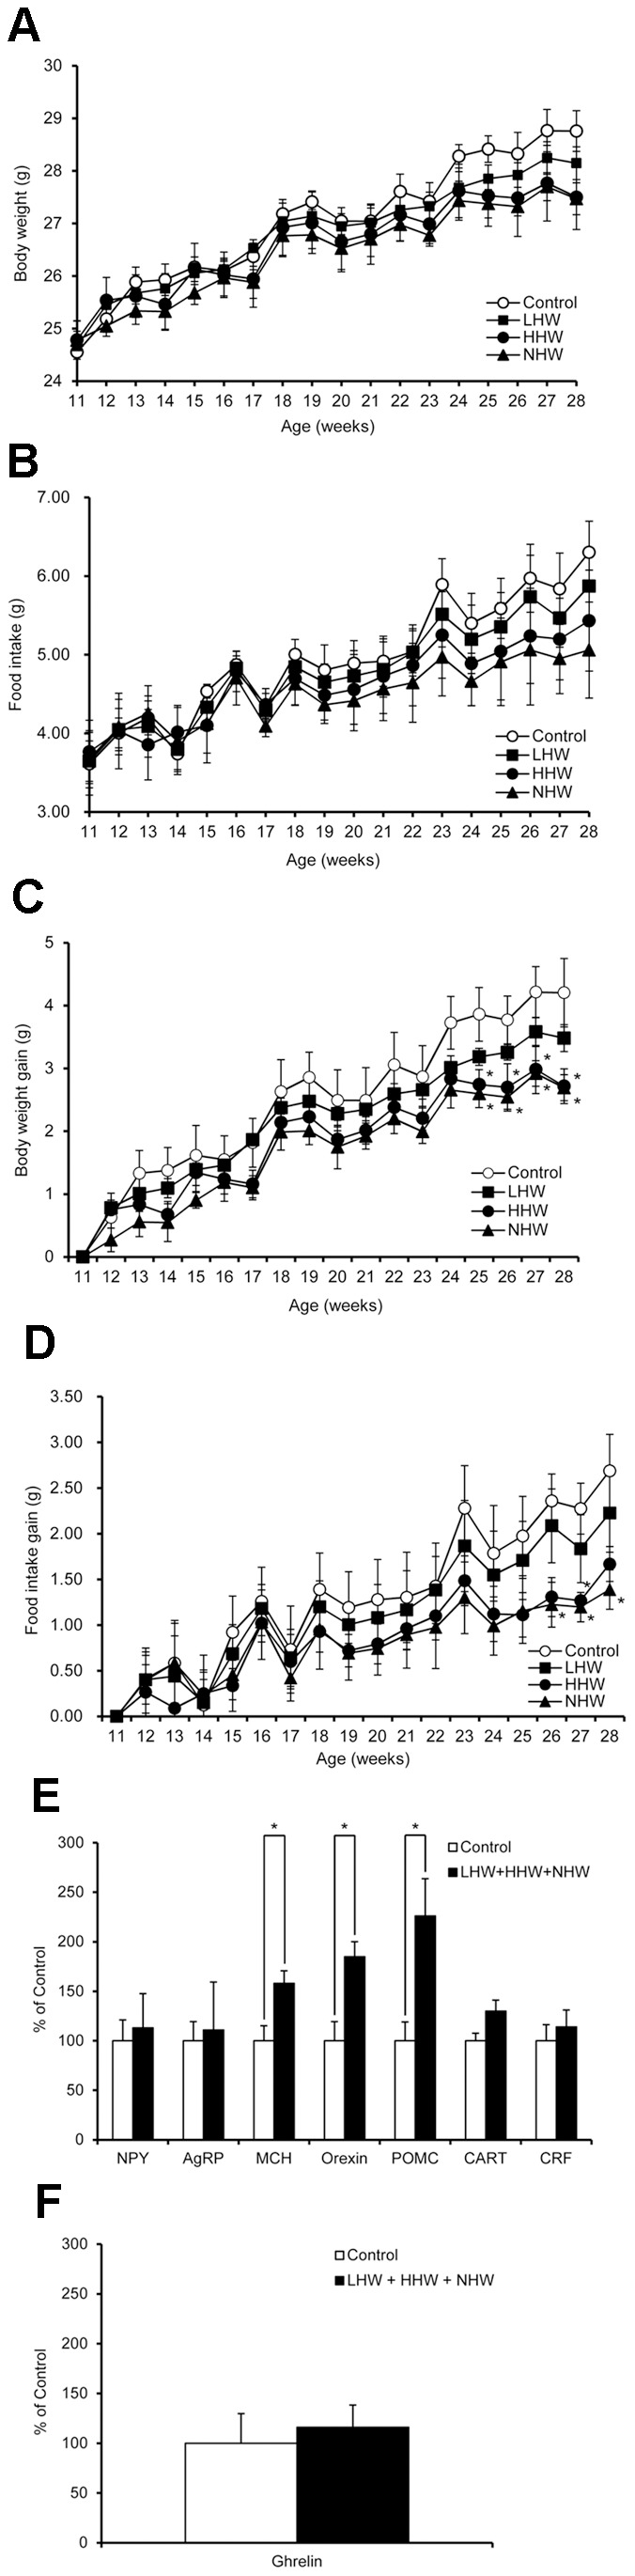
Figure 5. The effect of p.o. administration of H2 on food intake in STZ-induced type 1 diabetic mice.

Figure 5

(A, B) Body weights and food intake were measured every 7 days. Although there was no significant difference in body weight or food intake among the 4 groups (n = 6 for each group), the food intake in the LHW, HHW and NHW groups showed a tendency to decrease in the latter part of this experiment. (C) The body weight gain in the HHW group (n = 6) and NHW group (n = 6) was significantly lower than the control group (n = 6) at 25, 26, 27, and 28 weeks of age. (D) The food intake gain in the HHW group (n = 6) was significantly lower than the control group (n = 6) at 27 weeks of age. Additionally, the food intake gain in the NHW group (n = 6) was significantly lower than the control group (n = 6) at 26, 27, and 28 weeks of age. (E) Orexigenic melanin-concentrating hormone (MCH) and orexin mRNA and anorexigenic pro-opiomelanocortin (POMC) mRNA expressions in the hypothalamus were significantly increased in the combined LHW, HHW, and NHW group (n = 10) compared with the control group (n = 6). (F) There was no significant difference in ghrelin mRNA in the stomach (the control group, n = 6; the combined LHW, HHW, and NHW group, n = 10). Comparisons with controls were performed by Dunnett’s multipule comparison test. *P<0.05.

Chronic p.o. Administration of H2 has no Effect on Diabetes in High-fat Diet-induced T2DM Mice

The HHW group had a significantly decreased AUC in the day-90 IPGTT. However, there were no significant differences in blood glucose in the weekly measurements, in the AUC values of the day-30, -60, -120, -150, or -180 IPGTT, or in glycated albumin levels between the control and HHW groups (Table 3). Each group showed similar hyperinsulinemia.

Chronic p.o. Administration of H2 has no Effect on Diabetes in Type 2 Diabetic db/db Mice

There were no significant differences in blood glucose at the weekly measurements, in the AUC values of the day-30, -60, -90, or -120 IPGTT, or in glycated albumin levels between the control and HHW groups (Table 4). Several mice were lost by natural death from unknown causes after 120 days, so we sacrificed all of the mice in this experiment at that time. Each group showed similar hyperinsulinemia.

STZ-induced T1DM Mice Show the Highest Water Intake

The control water intake of STZ-induced T1DM mice and high-fat diet-induced T2DM and db/db mice were 19.94±0.75 (n = 6), 4.24±0.20 (n = 7), 15.01±0.67 (n = 7) ml/day, respectively. The NHW group showed no difference to the controls: 19.21±1.82 (n = 6, STZ), 3.92±0.18 (n = 7, high-fat), and 15.42±0.74 (n = 7, db/db) ml/day of water intake. The high-fat diet-induced T2DM mice did not differ significantly compared to normal mice in water intake (data not shown). Although the HHW group appeared not to be different from the NHW, the existence of dropped water due to the H2 bubbles made it difficult to measure correctly the water intake of this animal group.

Discussion

The gold-standard treatment for patients with T1DM remains intensive insulin therapy that should be provided in multiple daily injections or by continuous subcutaneous insulin infusion, complemented with frequent blood glucose monitoring. Advances in the understanding of the insulin molecule as well as the development of new devices for insulin administration have allowed treatment regimens to more closely mimic the physiologic insulin response of healthy individuals. However, various shortcomings of insulin therapies, such as the injectable nature of insulin, the development of insulin resistance, and the inability to reach excellent glycemic control due to hyperglycemia and hypoglycemia, have motivated researchers to develop noninsulin pharmacological therapies to manage T1DM. These include, but not are limited to, immunotherapeutic agents, incretin-based therapies, recombinant human insulin-like growth factors, stem cells, and the transplantation of pancreatic islets. Although some therapies, either independently or as adjuvant to insulin, are currently used to manage T1DM, most therapies are in developmental stages and/or are limited to use. Therefore, therapeutic alternatives to insulin that are freely available are needed , .

Our study demonstrates for the first time that H2 was effective in improving glycemic control in a STZ-induced type 1 diabetic animal model without producing hypoglycemia. This was achieved not only by intra-peritoneal administration of H2 but also by oral administration, despite the unstable nature of H2 in the water. Addition of salts such as sodium chloride could help maintain H2 concentrations in the water, as in NHW. Neither gross behavioral abnormalities nor apparent biochemical changes such as liver and kidney functions were observed during the 1–4-month experimental period. These results indicate that H2 therapy could overcome several drawbacks associated with insulin therapy.

H2 is a potent scavenger of reactive oxygen species (ROS). Both increased generation of ROS and impaired antioxidant defenses cause oxidative stress which is the process of cellular injury. The mitochondrial electron transport chain is the main source of ROS in most cells . Donating one electron to molecular oxygen results in the formation of superoxide (O2 −) . In physiological homeostasis, O2 − is converted to hydrogen peroxide (H2O2) by the enzyme superoxide dismutase (SOD) and H2O2 is converted into water by the enzymes catalase or glutathione peroxidase . In the presence of reduced transition metals (e.g., ferrous or cuprous ions), H2O2 can be converted into the most highly reactive hydroxyl radical (·OH) .

Not only H2, but also N-acetyl-cysteine (NAC) and vitamin C are well known as potent scavengers. As mentioned above, H2 selectively reduces the highly toxic ·OH in vitro . The selective deoxidization of H2 is due to its mild reducing power . We verified that H2 is a weak scavenger more than NAC and vitamin C in this study. Recently, several studies suggest that H2 increases the amount of SOD, catalase and heme oxygenase-1 , , . NAC directly scavenges H2O2 and ·OH in vitro . NAC also decreases free radical levels by increasing the glutathione synthesis , . NAC has historically been used as a mucolytic agent in a variety of respiratory illnesses. NAC also have beneficial effects in conditions characterized by decreased glutathione or oxidative stress, such as HIV infection, cancer, heart disease, and cigarette smoking . However, there are references in the literature implicating NAC in the oxidative damage of biological systems both in vitro – and in vivo , , depending on the experimental conditions, such as the presence or absence of transition metal ions. Vitamin C directly scavenges O2 −, H2O2 and ·OH in vitro . Although vitamin C has been credited with benefits in many human diseases such as atherosclerosis and cancer , , vitamin C may act as a pro-oxidant due to the high reactivity of vitamin C with transition metals, including iron , . In addition, a human study suggests that supplementation with both NAC and vitamin C increases oxidative stress and tissue damage . Few reports have described unwanted side effects of H2. The reason may be due to its mild antioxidant effect and H2 appears not to disturb physiological metabolic oxidation-reduction reactions or disrupt ROS involved in cell signaling .

SOD has a pivotal role in the detoxification of ROS . In C2C12 cells, it has been documented that the exposure to 2 mM of H2O2 did not reduce SOD activation . On the other hand, the exposure to 1 mM of H2O2 diminished SOD activation by almost 50% in HepG2 cells . These reports indicate that the antioxidant capacity of SOD in C2C12 cells is larger than HepG2 cells. Thus, REDOX state in cell seems lower in liver than that in muscle. Our results in C2C12 cells and HepG2 cells experiments indicate that the effect of H2 in Glut4 translocation may be independent of the antioxidant effect.

Up to 75% of insulin-dependent glucose disposal occurs in skeletal muscle . Insulin stimulates glucose uptake in skeletal muscle by promoting translocation of Glut4 from intracellular sites to the plasma membrane. Mouse C2C12 cells, derived from the mouse skeletal muscle C2 cell line, possess morphological, biochemical and metabolic properties similar to isolated skeletal muscle . In this study, H2 promoted 2-DG uptake into C2C12 cells by stimulating Glut4 translocation. This in vitro experiment also indicated that the Glut4 translocation was stimulated by at least PI3K, PKC, and AMPK signaling. PKC is classified into three groups according to activation node: conventional isoforms (α, ÎČ1, ÎČ2, and Îł), novel isoforms (ÎŽ, Δ, Ξ, and η), and atypical isoforms (ζ, λ/τ). Unlike conventional or novel PKCs, atypical PKC isoforms (aPKCs) have been suggested to act as downstream mediators of PI3K and play roles in insulin-stimulated glucose uptake and Glut4 translocation in adipocytes and skeletal muscle . Therefore, the increased expression of PKC isoforms in this study might have been aPKCs, although we did not directly measure aPKCs.

AMPK plays critical roles in regulating growth and reprogramming metabolism and has recently been implicated in autophagy and cell polarity . An important physiological process that AMPK promotes in skeletal muscle is glucose transport. This glucose transport occurs in the absence of insulin and also under the regulation of the insulin-responsive Glut4 . In muscle preparations of rodents and cultured L6 myotubes, two substances that activate AMPK, 5-aminoimidazole-4-carboxamide-1-ÎČ-D-riboside (AICAR) (which enters the cell and mimics 5â€Č-AMP) and dinitrophenol (DNP) (which uncouples mitochondrial oxidative phosphorylation, thereby increasing 5â€Č-AMP levels), also activate aPKCs. aPKCs are required for increases in Glut4 translocation to the plasma membrane and glucose transport during AICAR and DNP stimulation in L6 myotubes . This activation of aPKCs by AMPK occurs in the absence of PI3K signaling. Therefore, H2 may stimulate Glut4 translocation via the activation of aPKC, either by stimulating PI3K, activating signaling upstream of PI3K or activating AMPK signaling (Fig. 6). The signaling events may occur in a linear or parallel fashion with the latter converging upon Glut4 translocation.

Figure 6. The hypothetical model of H2 action in glucose excursion.

Hydrogen Improves Glycemic Control in Type1 Diabetic Animal Model by Promoting Glucose Uptake into Skeletal Muscle	
Hydrogen Improves Glycemic Control in Type1 Diabetic Animal Model by Promoting Glucose Uptake into Skeletal Muscle
Hydrogen Improves Glycemic Control in Type1 Diabetic Animal Model by Promoting Glucose Uptake into Skeletal Muscle Hydrogen Improves Glycemic Control in Type1 Diabetic Animal Model by Promoting Glucose Uptake into Skeletal Muscle
H2 promotes glucose uptake into skeletal muscle by stimulating Glut4 translocation by activating phosphatidylinositol-3-OH kinase (PI3K), atypical protein kinase C (aPKC), and AMP-activated protein kinase (AMPK) under conditions of severe insulin deficiency. H2 has little effect on glucose excursion under conditions of hyperinsulinemia and insulin resistance.

STZ is synthesized by Streptomyces achromogenes and is widely used to induce experimental diabetes in animals. STZ is taken up by pancreatic ÎČ-cells via Glut2. Although STZ is a nitric oxide (NO) donor and NO contributes to DNA damage in ÎČ-cells , , recent reports have shown that the main reason STZ induces ÎČ-cell death is alkylation of DNA , . NO possesses comparatively weak reactivity among ROS. Therefore, H2, which selectively reduces the strongest ROS, is unlikely to prevent the STZ-induced ÎČ-cell death as a therapeutic antioxidant. Indeed, the fasting plasma insulin levels in this chronic i.p. experiment with STZ-induced diabetic mice showed no significant difference between the control and HHS groups. Specifically, the results in the chronic i.p. and p.o. administration of H2 experiments in STZ mice suggest that the improvement of hyperglycemia and is due to the promotion of glucose uptake into skeletal muscle by stimulating Glut4 translocation.

Hyperphagia is a classical manifestation of uncontrolled diabetes, but the pathogenesis remains incompletely understood. Insulin receptor (IR) is expressed in most tissues of the body, including the neuronal tissue of the central nervous system (CNS). In the CNS, the IR displays distinct patterns of expression in the olfactory bulb, the hypothalamus, and the pituitary , . Insulin dysfunction in CNS could be a candidate for causes of diabetic hyperphagia, because mice in a neuron-specific knockout of the IR show increased food intake and body weight . Uncontrolled insulin-deficient diabetes induced by STZ is an established model of sustained hyperphagia in rodents. In our model of STZ-induced T1DM mice with chronic p.o. H2 administration, the food intake and body weight gain are significantly blunted in the treatment group. Therefore, H2 may have an inhibitory effect on feeding of T1DM mice as with insulin.

Neuropeptides in the hypothalamus play a pivotal role in physiologic mechanisms regulating food intake and body weight –. In the arcuate nucleus (ARC) in the hypothalamus, which specially plays a key role in regulating food intake, there are two neuronal populations with opposing effects on food intake: neurons which co-express NPY and AgRP stimulate food intake, whereas POMC neurons suppress feeding. A major mechanism underlying the effects of insulin to reduce food intake involves the regulation of hypothalamic neuropeptide systems . Specifically, insulin inhibits NPY/AgRP neurons and activates POMC neurons . Ghrelin is an important brain–gut peptide, an endogenous ligand of the growth hormone secretagogue (GHS) receptor from the stomach, and the first orexigenic peptide of the periphery , . Ghrelin increases food intake and body weight by activating hypothalamic NPY/AgRP neurons . A lack of meal-induced ghrelin suppression caused by severe insulin deficiency is considered one of the reasons for hyperphagia in uncontrolled T1DM –. In our chronic p.o. administration of H2 experiment with STZ-induced T1DM mice, anorexigenic POMC mRNA and orexigenic MCH and orexin mRNA expressions in the hypothalamus were significantly increased in the H2 treatment group compared with the control group. On the other hand, there was no significant difference in orexigenic ghrelin mRNA expression in the stomach. These results suggest that H2-induced anorexigenic effects may be mediated by POMC, and MCH and orexin be involved in other motivational behaviors that need to be clarified. It is to be determined whether or not POMC is involved in improvement on hyperglycemia in our model since POMC regulates glucose homeostasis and insulin sensitivity through distinct CNS populations from those regulating food intake and body weight .

In this study, we used two types of obese and T2DM mouse models: high-fat diet-induced diabetic mice and db/db mice. The H2 treatment had little effect on these animal models with hyperinsulinemia and insulin resistance: neither fasting glucose nor glycated albumin differed significantly in high-fat diet-induced diabetic or db/db mice. Although the origin of insulin resistance has been difficult to elucidate in part due to the diverse set of risk factors linked to this condition, the impaired insulin-stimulated glucose transport in muscle and adipose tissue is considered a major contributor to the pathogenesis of insulin-resistant states such as obesity and T2DM . The marked contrast in the effect of H2 in our T1DM and T2DM animal models suggest that H2 may converge on the insulin signals in the cells and not improve insulin sensitivity. The hyperglycemia causes a rise in serum osmolarity and thirst with polydipsia. STZ-induced diabetic animal models show very severe hyperglycemia and suffer from chronic polydipsia more than the T2DM mouse models, which may account in part for the difference in the effectiveness of H2 to reduce hyperglycemia.

In contrast to our data, Kamimura et al reported that 3-months p.o. administration of H2 water (0.8 mM) to db/db mice decreased plasma glucose, insulin and triglyceride levels, stimulated energy metabolism, and, as a result, suppressed the gain of fat and body weight . H2 attenuation was considered one of the reasons for these differences. The glass vessel used by Kamimura retained almost 100% of the original H2 in HHW after 24 hours, whereas our glass vessel retained only 64% of the H2 in HHW or 71% H2 in NHW after 24 hours. Kajiyama et al reported that 8 weeks p.o. administration of hydrogen-rich water (0.6 mM) did not improve plasma glucose, insulin, HbA1c or body weight in patients with T2DM or impaired glucose tolerance . Our data are in line with their clinical data. The difference in H2 administration methods may also have influenced the results, although our study indicates both i.p. and p.o. administration routes are effective in a T1DM model. Further studies are required to evaluate the molecular mechanisms of H2 and the effect of H2 treatment on T1DM and T2DM patients.

Much of the mortality of type 1 and type 2 diabetes results from long-term complications of microvascular (nephropathy, retinopathy, and neuropathy) and macrovascular (ischemic heart disease, peripheral vascular disease, and stroke) events. However, the onset and progression of diabetes complications correlates substantially with glycemic control. Therefore, the present findings of improved glycemic control by oral administration of H2 strongly suggest that H2 is a novel therapeutic molecule that could aid in type 1 diabetes management. Because the occurrence and progression of diabetes complications is influenced by the presence and degree of hypertension and dyslipidemia , the potential beneficial effects of H2 treatment on these nonglycemic risk factors , , including the improvement of triglyceride and free fatty acid levels in our study, are important and remain to be clarified in T1DM patients.

Previous study demonstrated that H2 could be detected in the venous blood of rats at the level of 5 ”M after 3 min of administration of saturated (0.8 mM) H2 water into the stomach . The concentration of H2 used in the study was similar to that in our study. H2 almost does not exist in artery but exist in vein around the level of 1 ”M in the physiological condition of rats , . Even the low concentration (0.04 mM) of H2 in drinking water was effective in the treatment of mouse model of Parkinson’s disease . The increased water intake together with these previous data indicates that ingested H2 could move to circulation and reach the target sites in our diabetic animal models.

In conclusion, our study demonstrates that H2 stimulates Glut4 translocation and glucose uptake into skeletal muscle and may be a novel therapeutic alternative to insulin in T1DM that can be administered orally.

Acknowledgments

We gratefully acknowledge VANA Co., Ltd. (Yamanashi, Japan) for the generous gift of natural hydrogen water.Funding Statement
This research is partially funded by the Young Researcher Overseas Visits Program for Vitalizing Brain Circulation of the Japan Society for the Promotion of Science. The authors gratefully acknowledge VANA Co., Ltd. (Yamanashi, Japan) for the generous gift of natural hydrogen water. The funders had no role in study design, data collection and analysis, decision to publish, or preparation of the manuscript.References
1.Wild S, Roglic G, Green A, Sicree R, King H (2004) Global prevalence of diabetes: estimates for the year 2000 and projections for 2030. Diabetes Care 27: 1047–1053.
2.Rinderknecht E, Humbel RE (1978) The amino acid sequence of human insulin-like growth factor I and its structural homology with proinsulin. J Biol Chem 253: 2769–2776.
3.Guler HP, Zapf J, Froesch ER (1987) Short-term metabolic effects of recombinant human insulin-like growth factor I in healthy adults. N Engl J Med 317: 137–140.
4.Frystyk J (2005) The growth hormone hypothesis – 2005 revision. Horm Metab Res 37 Suppl 144–48.
5.Gammeltoft S, Van Obberghen E (1986) Protein kinase activity of the insulin receptor. Biochem J 235: 1–11.
6.Taniguchi CM, Emanuelli B, Kahn CR (2006) Critical nodes in signalling pathways: insights into insulin action. Nat Rev Mol Cell Biol 7: 85–96.
7.Levitt MD (1969) Production and excretion of hydrogen gas in man. N Engl J Med 281: 122–127.
8.Ghoshal UC (2011) How to interpret hydrogen breath tests. J Neurogastroenterol Motil 17: 312–317.
9.Gharib B, Hanna S, Abdallahi OM, Lepidi H, Gardette B, et al. (2001) Anti-inflammatory properties of molecular hydrogen: investigation on parasite-induced liver inflammation. C R Acad Sci III 324: 719–724.
10.Ohsawa I, Ishikawa M, Takahashi K, Watanabe M, Nishimaki K, et al. (2007) Hydrogen acts as a therapeutic antioxidant by selectively reducing cytotoxic oxygen radicals. Nat Med 13: 688–694.
11.Fu Y, Ito M, Fujita Y, Ito M, Ichihara M, et al. (2009) Molecular hydrogen is protective against 6-hydroxydopamine-induced nigrostriatal degeneration in a rat model of Parkinson’s disease. Neurosci Lett 453: 81–85.
12.Ohsawa I, Nishimaki K, Yamagata K, Ishikawa M, Ohta S (2008) Consumption of hydrogen water prevents atherosclerosis in apolipoprotein E knockout mice. Biochem Biophys Res Commun 377: 1195–1198.
13.Fujita K, Seike T, Yutsudo N, Ohno M, Yamada H, et al. (2009) Hydrogen in drinking water reduces dopaminergic neuronal loss in the 1-methyl-4-phenyl-1,2,3,6-tetrahydropyridine mouse model of Parkinson’s disease. PLoS One 4: e7247.
14.Chen H, Sun YP, Li Y, Liu WW, Xiang HG, et al. (2010) Hydrogen-rich saline ameliorates the severity of l-arginine-induced acute pancreatitis in rats. Biochem Biophys Res Commun 393: 308–313.
15.Itoh T, Fujita Y, Ito M, Masuda A, Ohno K, et al. (2009) Molecular hydrogen suppresses FcepsilonRI-mediated signal transduction and prevents degranulation of mast cells. Biochem Biophys Res Commun 389: 651–656.
16.Kamimura N, Nishimaki K, Ohsawa I, Ohta S (2011) Molecular hydrogen improves obesity and diabetes by inducing hepatic FGF21 and stimulating energy metabolism in db/db mice. Obesity (Silver Spring) 19: 1396–1403.
17.Kajiyama S, Hasegawa G, Asano M, Hosoda H, Fukui M, et al. (2008) Supplementation of hydrogen-rich water improves lipid and glucose metabolism in patients with type 2 diabetes or impaired glucose tolerance. Nutr Res 28: 137–143.
18.Chang CJ, Kao JT, Lee TL, Lai CW, Cheng JT (1996) Comparison of isoproterenol with BRL37344 in activation of beta 3-adrenoceptors to inhibit the uptake of [14C]deoxy-D-glucose and translocation of glucose transporter (GLUT4) to membrane fraction in rat adipocytes. J Auton Nerv Syst 61: 191–194.
19.Surwit RS, Kuhn CM, Cochrane C, McCubbin JA, Feinglos MN (1988) Diet-induced type II diabetes in C57BL/6J mice. Diabetes 37: 1163–1167.
20.Zhang Y, Proenca R, Maffei M, Barone M, Leopold L, et al. (1994) Positional cloning of the mouse obese gene and its human homologue. Nature 372: 425–432.
21.Lee GH, Proenca R, Montez JM, Carroll KM, Darvishzadeh JG, et al. (1996) Abnormal splicing of the leptin receptor in diabetic mice. Nature 379: 632–635.
22.Chen H, Charlat O, Tartaglia LA, Woolf EA, Weng X, et al. (1996) Evidence that the diabetes gene encodes the leptin receptor: identification of a mutation in the leptin receptor gene in db/db mice. Cell 84: 491–495.
23.van Belle TL, Coppieters KT, von Herrath MG (2011) Type 1 diabetes: etiology, immunology, and therapeutic strategies. Physiol Rev 91: 79–118.
24.Garg V (2011) Noninsulin pharmacological management of type 1 diabetes mellitus. Indian J Endocrinol Metab 15: S5–S11.
25.Balaban RS, Nemoto S, Finkel T (2005) Mitochondria, oxidants, and aging. Cell 120: 483–495.
26.Giordano FJ (2005) Oxygen, oxidative stress, hypoxia, and heart failure. J Clin Invest 115: 500–508.
27.Droge W (2002) Free radicals in the physiological control of cell function. Physiol Rev 82: 47–95.
28.Chance B, Sies H, Boveris A (1979) Hydroperoxide metabolism in mammalian organs. Physiol Rev 59: 527–605.
29.Nakao A, Toyoda Y, Sharma P, Evans M, Guthrie N (2010) Effectiveness of hydrogen rich water on antioxidant status of subjects with potential metabolic syndrome-an open label pilot study. J Clin Biochem Nutr 46: 140–149.
30.Xie K, Yu Y, Pei Y, Hou L, Chen S, et al. (2010) Protective effects of hydrogen gas on murine polymicrobial sepsis via reducing oxidative stress and HMGB1 release. Shock 34: 90–97.
31.Aruoma OI, Halliwell B, Hoey BM, Butler J (1989) The antioxidant action of N-acetylcysteine: its reaction with hydrogen peroxide, hydroxyl radical, superoxide, and hypochlorous acid. Free Radic Biol Med 6: 593–597.
32.Neuschwander-Tetri BA, Bellezzo JM, Britton RS, Bacon BR, Fox ES (1996) Thiol regulation of endotoxin-induced release of tumour necrosis factor alpha from isolated rat Kupffer cells. Biochem J 320 (Pt 3): 1005–1010.
33.Song M, Kellum JA, Kaldas H, Fink MP (2004) Evidence that glutathione depletion is a mechanism responsible for the anti-inflammatory effects of ethyl pyruvate in cultured lipopolysaccharide-stimulated RAW 264.7 cells. J Pharmacol Exp Ther 308: 307–316.
34.Kelly GS (1998) Clinical applications of N-acetylcysteine. Altern Med Rev 3: 114–127.
35.Oikawa S, Yamada K, Yamashita N, Tada-Oikawa S, Kawanishi S (1999) N-acetylcysteine, a cancer chemopreventive agent, causes oxidative damage to cellular and isolated DNA. Carcinogenesis 20: 1485–1490.
36.Sagrista ML, Garcia AE, Africa De Madariaga M, Mora M (2002) Antioxidant and pro-oxidant effect of the thiolic compounds N-acetyl-L-cysteine and glutathione against free radical-induced lipid peroxidation. Free Radic Res 36: 329–340.
37.Su M, Yang Y, Yang G (2006) Quantitative measurement of hydroxyl radical induced DNA double-strand breaks and the effect of N-acetyl-L-cysteine. FEBS Lett 580: 4136–4142.
38.Wang AL, Wang JP, Wang H, Chen YH, Zhao L, et al. (2006) A dual effect of N-acetylcysteine on acute ethanol-induced liver damage in mice. Hepatol Res 34: 199–206.
39.Childs A, Jacobs C, Kaminski T, Halliwell B, Leeuwenburgh C (2001) Supplementation with vitamin C and N-acetyl-cysteine increases oxidative stress in humans after an acute muscle injury induced by eccentric exercise. Free Radic Biol Med 31: 745–753.
40.Ames BN (1983) Dietary carcinogens and anticarcinogens. Oxygen radicals and degenerative diseases. Science 221: 1256–1264.
41.Frei B, Stocker R, Ames BN (1988) Antioxidant defenses and lipid peroxidation in human blood plasma. Proc Natl Acad Sci U S A 85: 9748–9752.
42.Herbert V, Shaw S, Jayatilleke E (1996) Vitamin C-driven free radical generation from iron. J Nutr 126: 1213S–1220S.
43.Galley HF, Davies MJ, Webster NR (1996) Ascorbyl radical formation in patients with sepsis: effect of ascorbate loading. Free Radic Biol Med 20: 139–143.
44.Tanno M, Kuno A, Yano T, Miura T, Hisahara S, et al. (2010) Induction of manganese superoxide dismutase by nuclear translocation and activation of SIRT1 promotes cell survival in chronic heart failure. J Biol Chem 285: 8375–8382.
45.Siu PM, Wang Y, Alway SE (2009) Apoptotic signaling induced by H2O2-mediated oxidative stress in differentiated C2C12 myotubes. Life Sci 84: 468–481.
46.Bak MJ, Jun M, Jeong WS (2012) Antioxidant and Hepatoprotective Effects of the Red Ginseng Essential Oil in H(2)O(2)-Treated HepG2 Cells and CCl(4)-Treated Mice. Int J Mol Sci 13: 2314–2330.
47.Klip A, Paquet MR (1990) Glucose transport and glucose transporters in muscle and their metabolic regulation. Diabetes Care 13: 228–243.
48.Yaffe D, Saxel O (1977) Serial passaging and differentiation of myogenic cells isolated from dystrophic mouse muscle. Nature 270: 725–727.
49.Farese RV (2002) Function and dysfunction of aPKC isoforms for glucose transport in insulin-sensitive and insulin-resistant states. Am J Physiol Endocrinol Metab 283: E1–11.
50.Mihaylova MM, Shaw RJ (2011) The AMPK signalling pathway coordinates cell growth, autophagy and metabolism. Nat Cell Biol 13: 1016–1023.
51.Huang S, Czech MP (2007) The GLUT4 glucose transporter. Cell Metab 5: 237–252.
52.Chen HC, Bandyopadhyay G, Sajan MP, Kanoh Y, Standaert M, et al. (2002) Activation of the ERK pathway and atypical protein kinase C isoforms in exercise- and aminoimidazole-4-carboxamide-1-beta-D-riboside (AICAR)-stimulated glucose transport. J Biol Chem 277: 23554–23562.
53.Morgan NG, Cable HC, Newcombe NR, Williams GT (1994) Treatment of cultured pancreatic B-cells with streptozotocin induces cell death by apoptosis. Biosci Rep 14: 243–250.
54.Kroncke KD, Fehsel K, Sommer A, Rodriguez ML, Kolb-Bachofen V (1995) Nitric oxide generation during cellular metabolization of the diabetogenic N-methyl-N-nitroso-urea streptozotozin contributes to islet cell DNA damage. Biol Chem Hoppe Seyler 376: 179–185.
55.Delaney CA, Dunger A, Di Matteo M, Cunningham JM, Green MH, et al. (1995) Comparison of inhibition of glucose-stimulated insulin secretion in rat islets of Langerhans by streptozotocin and methyl and ethyl nitrosoureas and methanesulphonates. Lack of correlation with nitric oxide-releasing or O6-alkylating ability. Biochem Pharmacol 50: 2015–2020.
56.Elsner M, Guldbakke B, Tiedge M, Munday R, Lenzen S (2000) Relative importance of transport and alkylation for pancreatic beta-cell toxicity of streptozotocin. Diabetologia 43: 1528–1533.
57.Havrankova J, Roth J, Brownstein M (1978) Insulin receptors are widely distributed in the central nervous system of the rat. Nature 272: 827–829.
58.Marks JL, Porte D Jr, Stahl WL, Baskin DG (1990) Localization of insulin receptor mRNA in rat brain by in situ hybridization. Endocrinology 127: 3234–3236.
59.Bruning JC, Gautam D, Burks DJ, Gillette J, Schubert M, et al. (2000) Role of brain insulin receptor in control of body weight and reproduction. Science 289: 2122–2125.
60.Kalra SP, Dube MG, Pu S, Xu B, Horvath TL, et al. (1999) Interacting appetite-regulating pathways in the hypothalamic regulation of body weight. Endocr Rev 20: 68–100.
61.Inui A (2001) Ghrelin: an orexigenic and somatotrophic signal from the stomach. Nat Rev Neurosci 2: 551–560.
62.Schwartz MW, Woods SC, Porte D Jr, Seeley RJ, Baskin DG (2000) Central nervous system control of food intake. Nature 404: 661–671.
63.Kojima M, Hosoda H, Date Y, Nakazato M, Matsuo H, et al. (1999) Ghrelin is a growth-hormone-releasing acylated peptide from stomach. Nature 402: 656–660.
64.Nakazato M, Murakami N, Date Y, Kojima M, Matsuo H, et al. (2001) A role for ghrelin in the central regulation of feeding. Nature 409: 194–198.
65.Ishii S, Kamegai J, Tamura H, Shimizu T, Sugihara H, et al. (2002) Role of ghrelin in streptozotocin-induced diabetic hyperphagia. Endocrinology 143: 4934–4937.
66.Dong J, Peeters TL, De Smet B, Moechars D, Delporte C, et al. (2006) Role of endogenous ghrelin in the hyperphagia of mice with streptozotocin-induced diabetes. Endocrinology 147: 2634–2642.
67.Murdolo G, Lucidi P, Di Loreto C, Parlanti N, De Cicco A, et al. (2003) Insulin is required for prandial ghrelin suppression in humans. Diabetes 52: 2923–2927.
68.Xu Y, Elmquist JK, Fukuda M (2011) Central nervous control of energy and glucose balance: focus on the central melanocortin system. Ann N Y Acad Sci 1243: 1–14.
69.RA D (1997) Pathogenesis of type 2 diabetes mellitus: metabolic and molecular implications for identifying diabetes genes. Diabetes Rev 5: 177–269.
70.American Diabetes A (2010) Standards of medical care in diabetes–2010. Diabetes Care 33 Suppl 1S11–61.
71.Nagata K, Nakashima-Kamimura N, Mikami T, Ohsawa I, Ohta S (2009) Consumption of molecular hydrogen prevents the stress-induced impairments in hippocampus-dependent learning tasks during chronic physical restraint in mice. Neuropsychopharmacology 34: 501–508.
72.Nakashima-Kamimura N, Mori T, Ohsawa I, Asoh S, Ohta S (2009) Molecular hydrogen alleviates nephrotoxicity induced by an anti-cancer drug cisplatin without compromising anti-tumor activity in mice. Cancer Chemother Pharmacol 64: 753–761.
Share: